LED display maintenance KPIs should show whether the display service is available, faults are detected and restored efficiently, planned work is completed, repeat problems are declining, and the evidence behind each result is trustworthy. A useful dashboard does not reward teams for closing tickets quickly while the screen remains degraded. It connects operational impact, technical work, verification, and unresolved risk.
The right measures depend on the venue, service hours, redundancy, event schedule, support model, and business consequence of lost display service. Buyers should define each KPI before collecting data: scope, formula, clock rules, exclusions, data source, owner, reporting interval, target, and action threshold. Without that register, two suppliers can report the same label while measuring different things.
Which KPIs should an LED display maintenance dashboard track?
Direct answer: start with service availability, user-impacting incidents, time to acknowledge, time to restore service, repeat-fault rate, preventive-maintenance completion, first-time restoration, spare-parts fulfillment, configuration compliance, and overdue corrective actions. Add project-specific measures only when they lead to a decision. Every figure should link to the assets, incidents, maintenance records, monitoring events, parts transactions, and acceptance evidence used to calculate it.
- Measure the service the customer receives, not only device uptime.
- Separate full outages, degraded operation, invisible redundancy loss, and cosmetic defects.
- Define when each clock starts, pauses, resumes, and stops.
- Normalize incident counts by a meaningful exposure such as service hours, events, or installed units.
- Keep planned work and corrective work visible as separate flows.
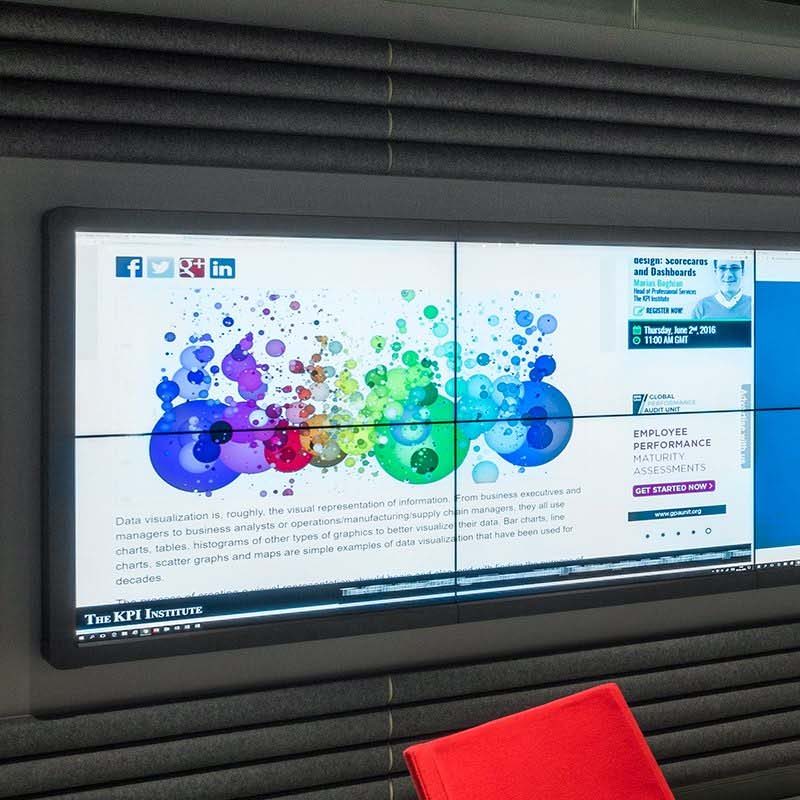
- Show current performance, trend, target, data completeness, and open risk together.
- Assign every red or amber condition to a named action owner.
Build a KPI register before building the dashboard
A KPI register is the control document behind the charts. For each metric, record its purpose, formula, population, unit, service calendar, severity scope, exclusions, source systems, reporting owner, review frequency, target, and escalation rule. Use the asset names and system boundaries in the LED display as-built documentation so that dashboards, work orders, controller maps, and service reports refer to the same equipment.
Version the register when definitions change. If an organization expands the monitored estate, changes service hours, introduces redundancy, or starts counting partial degradation, label the reporting break. A cleaner chart is not worth losing comparability or hiding a change in measurement scope.
Use a balanced LED service KPI set
On smaller screens, swipe horizontally to view all columns.
| KPI | Practical definition | Required evidence | Management question |
|---|---|---|---|
| Service availability | Scheduled service time available for the agreed use | Service calendar, incident intervals, degradation rules | Was the display service available when required? |
| Incident rate | Qualifying incidents per agreed exposure unit | Incident records, operating hours, event count, asset population | Are faults becoming more or less frequent? |
| Time to acknowledge | Elapsed time from a valid alert or report to accountable acknowledgement | Monitoring timestamp, service-desk record, acknowledgement | Does support react within the agreed route? |
| Time to restore | Elapsed time until agreed service is restored | Impact timeline, restoration test, acceptance time | How long does user impact continue? |
| Repeat-fault rate | Closed cases that recur under the agreed definition and review window | Failure category, asset, cause status, reopen record | Are fixes durable? |
| Planned-work completion | Due preventive tasks completed on time and accepted | Maintenance plan, due date, completed record, exceptions | Is risk-reduction work actually being performed? |
| Spare fulfillment | Qualifying requests supplied with a compatible part in the required time | Part request, stock issue, compatibility and installation record | Can inventory support restoration? |
| Open corrective risk | Unresolved defects grouped by impact, age, dependency, and owner | Deferred-work register, limitation, target and approval | What risk remains after tickets are closed? |
This set balances outcomes, speed, prevention, quality, logistics, and risk. It is not a universal contract schedule. Select the smallest group that reflects the customer’s operating priorities and can be supported by reliable evidence.
Measure service availability with an agreed boundary
A common availability formula is: (scheduled service time − qualifying unplanned downtime) ÷ scheduled service time × 100. The difficult part is not the arithmetic. Teams must agree what counts as scheduled service, when downtime begins, whether partial canvas loss is weighted or classified separately, and how planned maintenance, customer-controlled sources, venue power, content systems, or third-party networks are handled.
For a redundant system, a failed primary path may leave the audience experience available while removing resilience. Report that condition as degraded or at-risk service instead of either a full outage or no event. Align the rules with the LED display maintenance SLA so the operational dashboard and contract review use the same service definition.
Separate acknowledgement, response, restoration, and repair
These clocks answer different questions. Acknowledgement confirms that an accountable team has received a valid alert. Response may mean remote diagnosis, dispatch, or arrival, depending on the agreement. Restoration is the return of the agreed service, which may use a redundant path, temporary module, alternate source, or degraded mode. Repair is the completion and acceptance of the permanent technical correction.
Do not label every interval “MTTR.” Define the event that starts and stops each measure. State whether clocks run only during coverage hours, how customer access delays are recorded, and whether waiting for an approved maintenance window pauses a contractual timer. Preserve the full timeline in the LED display incident report.
Normalize incident counts before comparing systems
A raw count can be misleading. A large display operating every day has more exposure than a small display used for occasional events. Depending on the decision, report qualifying incidents per operating hour, service period, event, installed cabinet, or another stable denominator. Keep severity visible; ten corrected pixel defects should not be presented as equivalent to ten user-visible outages.
When the installed population or operating schedule changes, show the denominator and the date of change. Compare like-for-like categories and retain the underlying count. Normalization supports interpretation; it should not make the actual workload disappear.
Track repeat faults and first-time restoration carefully
A repeat-fault metric needs an agreed relationship: same asset, symptom, failure mode, cause, or service effect within a defined validation window. A second black module in another cabinet may be the same component family issue but not a reopened repair. A recurring symptom may also have a different cause. Keep “cause unconfirmed” as a valid status instead of forcing a convenient category.
First-time restoration can be expressed as qualifying incidents restored without repeat intervention during the agreed validation period divided by qualifying restored incidents. Exclude cases that cannot reasonably be evaluated, and disclose those exclusions. Use the verification evidence required by the LED display maintenance log before counting a case as successfully restored.

Measure preventive maintenance as accepted work
A practical completion measure is: planned tasks completed on time and accepted ÷ tasks due in the period × 100. Define “completed” to require the expected checks, evidence, exceptions, and review—not simply a changed status. Separate work that was not required after an approved scope change from work that was deferred, inaccessible, incomplete, or closed without evidence.
Completion rate alone can reward unnecessary tasks. Review whether the plan addresses actual failure modes, environmental conditions, access needs, cleaning, connection security, cooling, software, backups, and operator checks. Update the plan when repeat failures or monitoring trends show that the interval or task content is not controlling risk.
Connect spare-parts KPIs to compatibility and recovery
Stock quantity is not the same as restoration readiness. A spare module may be physically present but incompatible by batch, connector, receiving-card mapping, calibration group, firmware, or mechanical revision. Measure whether qualifying requests receive a compatible, serviceable part within the required time, then reconcile the issue, removed part, installed position, test result, and stock balance.
Track stockouts, quarantined items, repair turnaround, warranty returns, obsolete parts, and untested inventory separately. Use the LED display spare-parts planning guide to align holdings with installed configuration, failure history, logistics, service criticality, and storage conditions.
Include configuration and monitoring data quality
A dashboard can be precise and still wrong. Track the proportion of in-scope assets mapped correctly, expected monitoring signals reporting, timestamps synchronized, maintenance records complete, and sampled configurations matching the accepted baseline. Display data freshness and missing-data warnings beside the KPI instead of hiding them in a footnote.
Remote alarms should be tested against real conditions and known asset positions. Follow the LED display remote monitoring checklist for asset mapping, threshold ownership, notification routes, escalation, and acceptance tests. After approved changes, update the baseline through the access and change management plan.
Design the dashboard for action, not decoration
- Show the current value, target or operating band, prior-period comparison, and longer trend.
- Let users move from an aggregate measure to affected sites, displays, assets, incidents, and work records.
- Separate customer impact from technical condition and invisible resilience loss.
- Show both the numerator and denominator when a percentage could hide low volume.
- Flag missing, late, manually overridden, or definition-changed data.
- Add the owner, action, dependency, and due date for material exceptions.
- Use consistent severity colors and include text labels so meaning does not depend on color alone.
A single executive page can summarize service outcomes, but technical teams still need drill-down evidence. Avoid combining unlike measures into an unexplained “health score.” A simple set of transparent metrics is usually easier to govern, challenge, and improve.
Set targets from risk and baseline evidence
There is no universal availability, response, repeat-fault, or completion target for every LED installation. Targets should reflect operating hours, audience impact, redundancy, access, support coverage, event calendar, spare strategy, logistics, safety constraints, and cost. Start with a clean baseline, identify material failure modes, and set thresholds that trigger a defined management response.
Distinguish contractual commitments from internal improvement goals and early-warning levels. A target can become counterproductive when it encourages teams to downgrade severity, pause clocks without evidence, close unresolved work, or avoid logging minor defects. Review the behavior created by the measure as well as the number itself.
Run a monthly service review that closes actions
A useful review explains significant movements, data gaps, repeated faults, aging corrective work, missed preventive tasks, parts constraints, configuration deviations, training needs, and upcoming operating risks. Compare results with the accepted definitions, then assign actions with an owner, due date, evidence requirement, and closure authority.
Do not let averages hide severe cases. Review the distribution and the exceptions: the longest restoration, highest-impact incident, oldest open defect, repeated asset, missed critical task, and largest data gap. A small number of well-chosen examples can make the aggregate trend understandable without turning the meeting into a ticket-by-ticket recital.
What should buyers require at handover?
- An asset register and service boundary aligned with the final installation.
- A KPI register with formulas, clocks, exclusions, owners, targets, and version control.
- Incident, maintenance, monitoring, parts, configuration, and acceptance data sources.
- Severity and service-status definitions that distinguish outage, degradation, resilience loss, and cosmetic defects.
- A dashboard with trend, denominator, data-quality indicators, drill-down, and action ownership.
- Named responsibilities for the customer, operator, integrator, manufacturer, IT team, and service provider.
- Reporting cadence, review agenda, exception process, and corrective-action workflow.
- Exportable records and retention rules so history remains usable if platforms or suppliers change.
- Demonstration that sample dashboard figures reconcile with source records before acceptance.
Questions about LED display maintenance KPIs
Is uptime the same as LED display availability?
Not necessarily. A controller or monitoring agent may be online while the audience-facing service is unavailable or degraded. Define availability around the agreed service, scheduled period, affected area, sources, redundancy, and user impact.
Should planned maintenance reduce availability?
That depends on the approved definition and contract. Planned work within an agreed exclusion window is often reported separately, while unapproved overrun or work during required service may count against availability. Keep the excluded duration visible.
What is a good restoration-time target?
Set it from operational impact, coverage, access, redundancy, spares, logistics, and cost rather than copying a generic benchmark. Define the start, stop, pauses, severity, and required acceptance test before agreeing to the target.
How many KPIs should an LED service dashboard show?
Use the smallest set that represents outcomes, responsiveness, preventive work, fix quality, parts readiness, data quality, and open risk. A metric that has no owner or decision rule is usually a reporting statistic, not a KPI.
Who owns LED maintenance KPI definitions?
The customer’s designated service owner should approve definitions and risk decisions. Integrators, manufacturers, IT teams, operators, and service providers contribute technical and contractual detail, but no supplier should change the measurement basis silently.
Make every metric lead to a service decision
Effective LED display maintenance KPIs connect the audience-facing service to incidents, response, restoration, prevention, repeat faults, parts, configuration, evidence quality, and open risk. The dashboard is useful when a reviewer can understand what changed, trust the calculation, reach the underlying records, and assign the next action.
KSSdisplay can help project teams define service boundaries, handover data, monitoring points, maintenance records, spare-parts traceability, and support reporting for an LED installation. Review the available support resources or contact KSSdisplay with the application, display quantity and configuration, operating schedule, service coverage, redundancy, location, and target handover date.